
Fitbit's Pulse rate monitoring algorithm explained!
Hey friends, Happy Wednesday!
Blog post
My blog post S1E5 on the pulse rate monitoring algorithm is out! Happy learning!
Learn how Pulse rate is computed in a Fitbit
Answer to the question I posed last week
Last week, I asked how heartbeats are detected, besides how fitness watches detect them. Electrocardiogram (ECG) is a popular technique - It works by recording the electrical activity of the heart using multiple electrodes. These are also used to measure heart rate and diagnose heart diseases.
The concept we’ll cover this week to understand the pulse rate monitoring algorithm is the sampling of signals. I aim to write my newsletter issues in a way one can follow them while traveling on a bus, having a coffee, waiting for your food, etc. Let's jump in!
Sampling of Signals 101
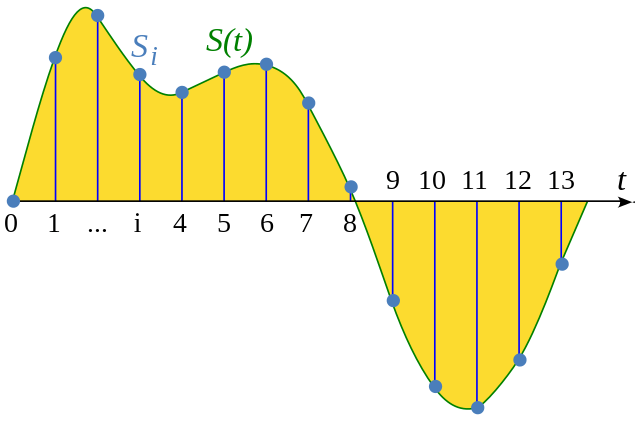
Sampling is the reduction of a continuous-time signal to a discrete-time signal. Basically, a continuous graph is converted to a series of (x,y) coordinate points as seen in figure 1 for example. The value of the signal S(t) in the Y axis now becomes an array of Si where i is the time instance. In this example, we sample every second as X coordinate values of time are 1, 2, 3, and so on. Sampling is super helpful when we are post-processing a signal on a computer to further perform other processes. This is because computers are digital and process information in 0s and 1s (NOTE: There are also analog computers but they are not the predominant ones we use to develop gadgets). Even your phone screens don't get continuously updated - it might seem like it’s continuous. But in reality, it’s sampled in a way. It has a certain frequency, 60 Hz for example, which means that your screen refreshes 60 times a second, nothing more or less.
Source: Wikipedia
A Sine curve after sampling becomes a series of (x,y) coordinates that looks like a sine curve when the individual data points are connected. Here is the catch - The frequency with which we sample is super important and it cannot be randomly chosen. Let me give you an example. Imagine that we have a sine curve signal that repeats itself every 2 seconds. But when you also choose to sample every 2 seconds periodically, you get the same Y value of the sine curve, resulting in a straight line when you connect all the coordinates. We should be able to trace back the signal after sampling by connecting the coordinates as we don't want a completely different signal altogether after sampling. It works against the purpose of sampling.
Question of the week
What is the minimum frequency in which a sine curve signal should be sampled so it can be retraced without losing information? Does it have a name? Share your thoughts by replying to this email, and we can have a discussion. I’ll answer this in next week’s issue.
Upcoming Blog Posts
I’m thinking of writing about the tech behind a self-cleaning water bottle for the next episode S1E6. Also, let me know if you’d like to read about a specific gadget/device. Thank you for reading!
Have a nice rest of the week, and take care!
Until next Wednesday,
Chendur